Leaflet Experiments Using Folium
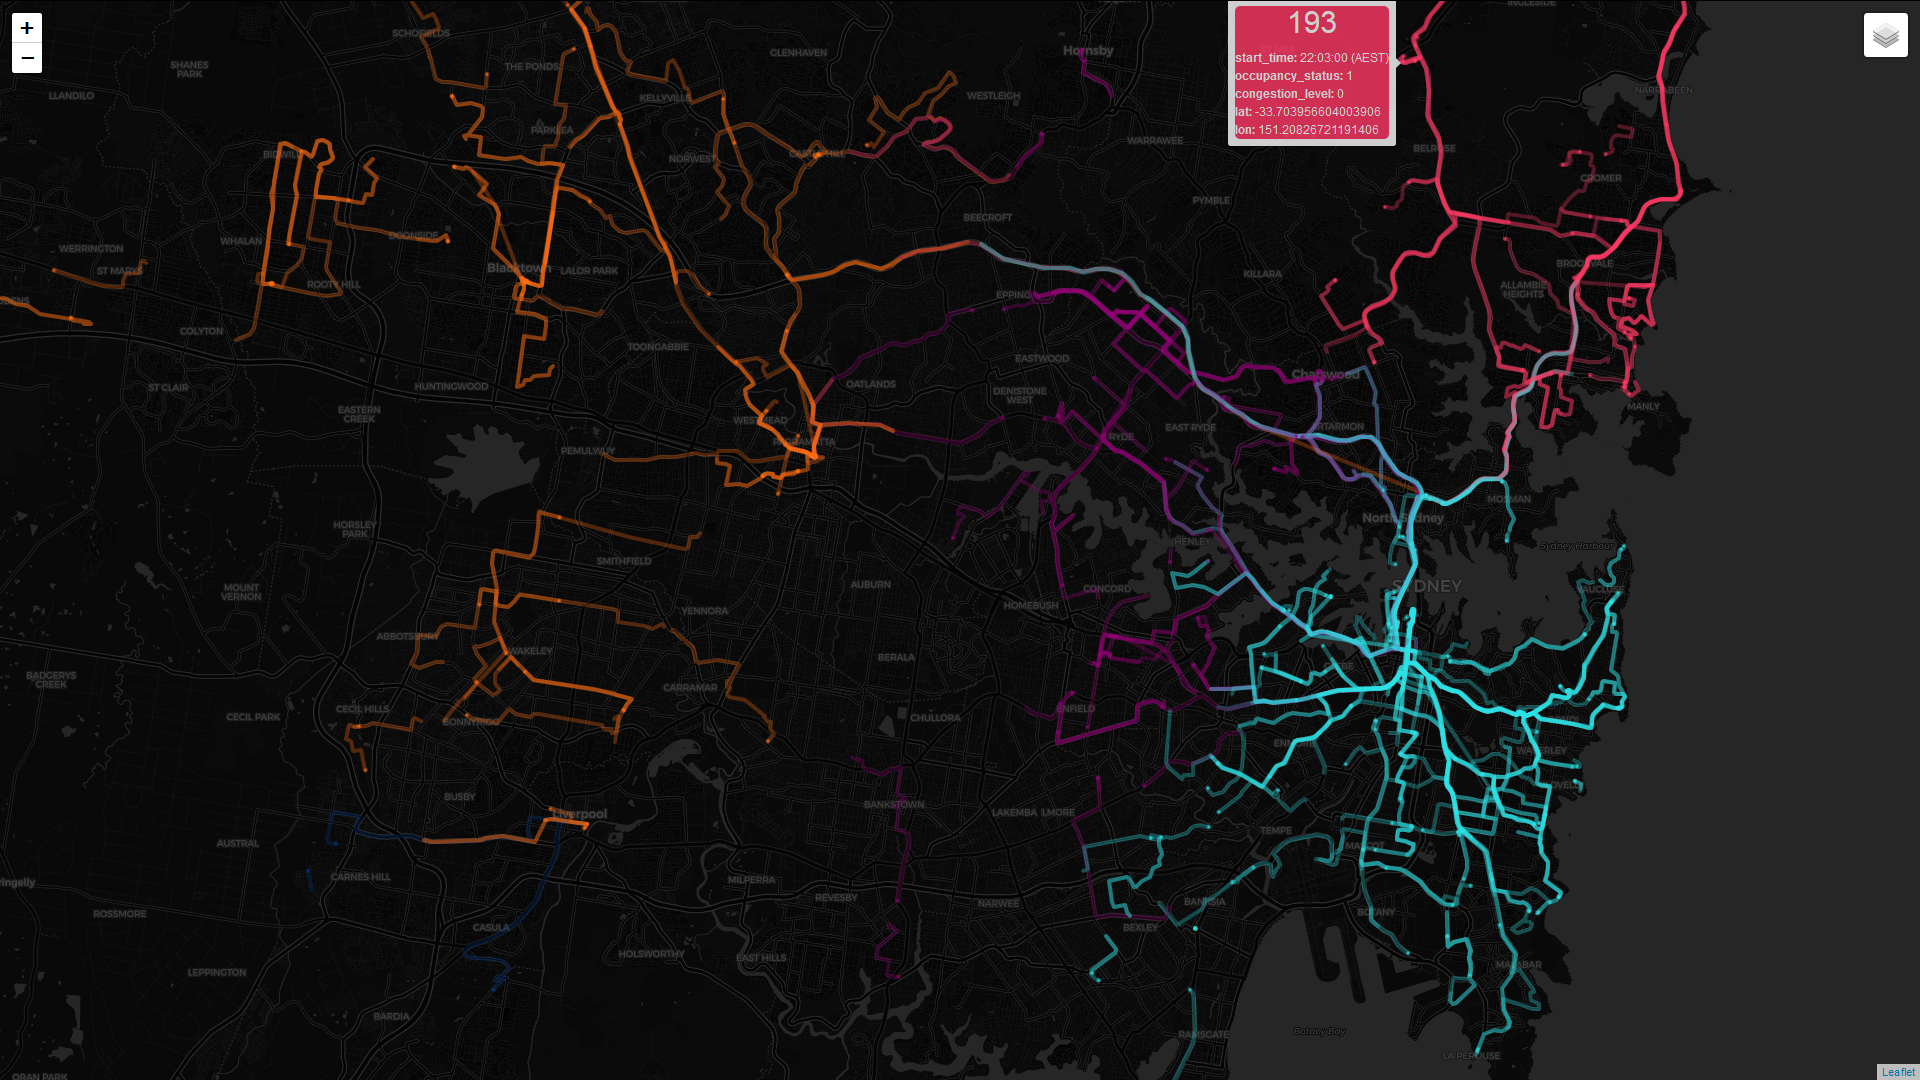
Leaflet showing (past) live bus data in NSW, Australia via TfNSW API
(non-interactive version, interactive version to be added.) Live bus data captured and rendered using folium (python leaflet generator library).
About Data
Data is from NSW (Australia) TfNSW API for live bus positions.
The data is requested from an endpoint. The files are in a protocol buffer, so the majority of this project was understanding how they work. If you never encountered them before, protocol buffers are a google invented format of transfer for serialised objects. This is in competition with JSON, XML, etc.
If you are using the transport format GTFS, the easy way to deserialise the data is via python’s gtfs-realtime-bindings.
Folium + Leaflet Map
Then, all the work was making the leaflet via folium. The graph shows the end-point of buses (CircleMarker), and their path during the recording period (PolyLine). The colouring is based solely on coordinate position. This was created using k-means clustering into 7 clusters.
