Experiment with AWS and Mode Dashboards / Reports

Experiment using fake data in a Mode Analytics Report (Dashboard)
Quick Description
This article is a summary of how I created a dashboard using Mode Analytics. I did it to test the feasibility of a cloud-hosted dashboard to analyse my personal data. I always keep a development log for my personal posts, so it was quite easy to translate that into an article format.
The requirements for Mode: a database connection as the data source.
This requires a hosted database instance. I decided to use AWS to create and host a relational database. This was through their AWS RDS service. The database I chose was PostgreSQL.
The summary below details each major step of the process in dot-form.
Overview of each project component
Creating a sample table for the database
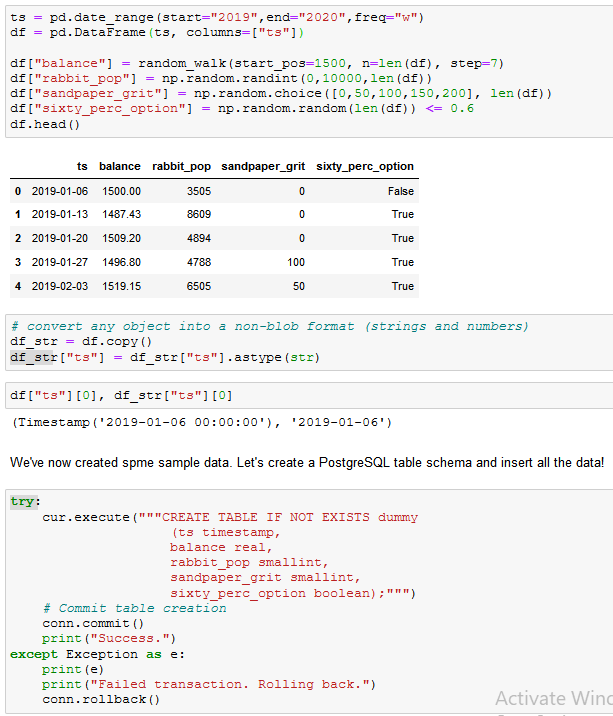
Generated data using NumPy
- Needed different types of variables with different distributions. This is to test a diverse range of visualisations.
- date data, numerical from random walk distribution, numerical from random normal distribution, random categorical choice data, boolean values in a specific true:false ratio

Process of generating the sample data and creating the PostgreSQL db table. The connection is made prior to this screenshot.
Convert timestamps into a format suitable for the PostgreSQL timestamp type.
-
for this sample data, I just converted the
datetime.datetimeobject into it’s string /__str__()representation. -
Later I tested with real data, and wanted to store time zone information. This required only a bit of tweaking:
- convert timestamps to ISO format string to be read by PostgreSQL as a
timestamptztype value:datetime.datetime.isoformat()was sufficient.
- convert timestamps to ISO format string to be read by PostgreSQL as a
insert data into database using the psycopg2 Python library
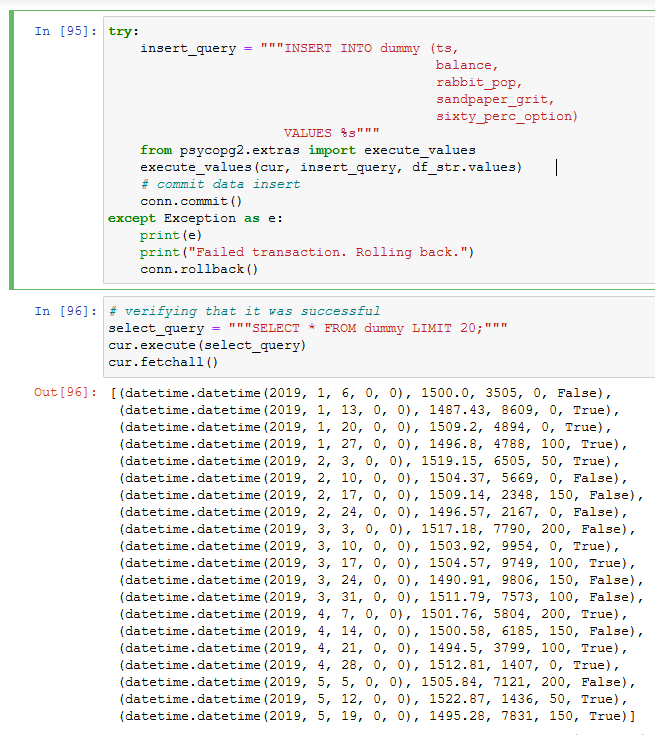
Inserting data into the previously created
dummytable, and verifying that the INSERT transaction was committed successfully.
Creating a cloud-hosted database
I chose AWS due to:
- it’s popularity
- my desire to learn more about AWS
I chose PostgreSQL as it is:
- quite popular, possibly meaning more up-to-date support resources
- had no past experience with it
- Free with AWS Free-Tier
- More likely to be relevant in the future to me than MySQL (the second option I was considering)
I have used MySQL and SQLite before, and the Python interface was very similar.
AWS RDS (Relational Database Service)
- simple enough to setup. However had to watch out for a few things. For example:
Cost minimisation:
Trap #1: Storage autoscaling

Trap #2: Enhanced Monitoring
- was also enabled by default
Trap #3: No spending limits by default with AWS
I setup a AWS budget to warn me about any costs. This was not setup by default.
Security Maximisation
To allow remote access to the database instance, I needed to change the settings for the relevant AWS security group.
- while searching for a solution, a YouTube comment mentioned one solution: allow all TCP activity. This comment has 27 likes. I hope they are not cloud engineers. If they are, then I am not surprised as to why there are so many AWS security misconfigurations and incidents!
- My solution was to allow inbound traffic from my IP only. Mode also required a few IP addresses to be allowed through for their connections. That just required another inbound TCP rule.

How the database instance appears once it has been setup.
Creating the dashboard
I chose Mode analytics as it:
- has Jupyter notebooks integration
- was recommended by a friend
- no-code visualisations
- free for my use case
- cost: one alternative - Tableau Desktop - costs $70 / month. That’s the main reason that Tableau is eliminated as an option
The caveat with Mode:
- it requires a hosted database as a data source
- I could have locally hosted something, but I wanted to try out cloud hosting.
Creating a report (Mode’s name for a single dashboard)
- make a SQL Query (e.g.
SELECT * FROM dummy LIMIT 100;) to be used as the data source for all the visualisations. - Create charts (somewhat similar to Tableau)
- use Jupiter Notebook
- access the results of any SQL Queries as Pandas DataFrames (Python)
- can display any arbitrary notebook Output like a chart
- after some testing, here’s what I found:
- cannot render Markdown or LaTeX to a cell’s output using the
IPythonlibrary - however I can render html (
IPython.display.HTML). That would allow for some creative things.- unfortunately some libraries like Plotly were broken because in Mode you don’t have control over the virtual environment
- cannot render Markdown or LaTeX to a cell’s output using the
- How to make Jupyter charts pretty:
- make the chart background transparent
- change all the text colours to something more visible on the report
This ensures that the colour scheme is maintained.
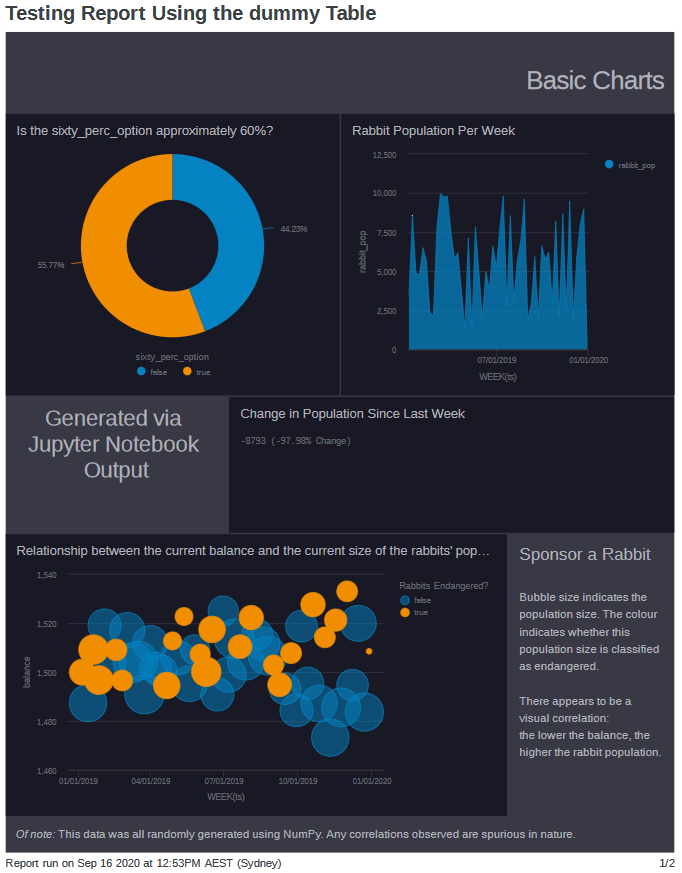
A screenshot of the report that I created. All the data is fake, but was generated with enough variety to approximate how the real data could look.
Queries used for debugging PostgreSQL
some miscellaneous queries used for testing purposes
one way to disconnect all connections (besides the one used to send the query)
SELECT pg_terminate_backend(pg_stat_activity.pid) -- function to terminate a session, identified using the session's pid
FROM pg_stat_activity --get all the process ids from pg_stat_activity
WHERE pg_stat_activity.datname = 'TARGET_DB' --any connection to this db
AND pid <> pg_backend_pid(); --but not the current connection (remove this line to terminate all sessions including this one)
Viewing existing tables
SELECT * FROM pg_catalog.pg_tables
WHERE schemaname != 'pg_catalog'
AND schemaname != 'information_schema';
Conclusion
It was a valuable learning experience overall:
Cloud hosting using AWS and RDS
-
minimising costs
-
maximising security
-
managing DB instances and connections.
PostgreSQL
-
data types
-
CRUD operations
-
psycopg2 Python library
-
pgAdmin4 local dashboard
Mode dashboard
Luckily I exported a pdf of the Mode report I created, since I accidentally deleted it about 5 minutes after!
¯\(ツ)/¯ It doesn’t actually matter. It already served it’s purpose. It would take about 10 minutes to recreate if it was necessary, since all the data is still there.
Will I use Mode for my real data?
No. Through the process of trying out Mode, I realise that all my required functionality can be done locally. Additionally it does not matter if the database is hosted, or if it is serverless (e.g. sqlite).
- All my data lives on the same computer as my dashboard, so it doesn’t make much sense to send it to a cloud database just to send it back to the same original pc.
As an alternative to a web dashboard, here is my current plan:
Create a windows application using Qt Designer as a dashboard. The graphs would be updated using the
pyqt5Python library.To periodically retrieve new data, I would setup a windows service that requests non-duplicate data and stores them somewhere.
For data storage: the current thought is to switch to
sqlite. However I did enjoy having a fully-featured database, so I may look at ways to locally host a PostgreSQL database.
That’s it! If anyone reads this, feel free to let me know via one of the links down below!
